EE Stock Charts 19
Paid Version
Publisher Description
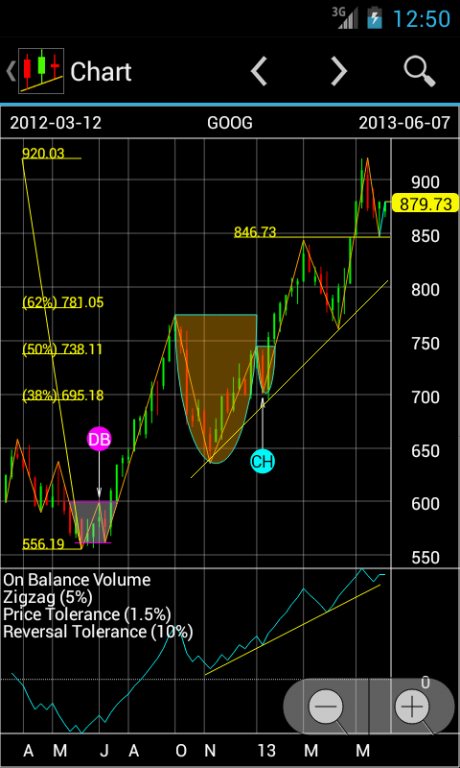
This App creates interactive charts and facilitates Technical Analysis of stock charts. Its strength is a user interface with ‘touch’ friendly commands to draw Trend Lines, Support Lines, and Retracement Lines over stock charts. Its set of indicators also generates Buy and Sell signals over charts. The profitability of these signals is tracked individually on a Trade screen and a comparison of the relative profitability of all indicators over the time frame is also calculated. Common Price Patterns are identified. This App helps you learn about the stock you want to trade (with NO Advertising).
PLEASE NOTE:
1. Data is downloaded from Yahoo Finance and quotes are 15 min. delayed approx
2. Yahoo Finance historical data is 1-2 days out of date for certain Asian Exchanges
Chart Lists and Individual Charts:
- Charts can be viewed as part of watch lists, or individually by symbol
- Create one or more watch lists. The App saves each list for future use
- Add stock symbols to each list. Trading details can optionally be entered for each symbol
- View current stock price data for each symbol in a list
- Tap a symbol in the selected List to view current stock data in chart format
- Save charts for later review while not connected to the internet
Saved Charts:
- View any chart previously saved. Viewing charts can be done while not connected to the internet
- Delete individual charts or all charts to manage storage
Features:
- Access detailed Help for each screen
- View training videos on You Tube:
- http://youtu.be/3weArYctcZQ (demo without lists)
- http://youtu.be/YEEpK1C9WGM (demo with lists)
- The App is installed with Default values for various options. The Settings Menu enables changes to options.
- Select the type of data and the date range. The type of data can be Daily, Weekly, or Monthly. The date range can vary from 3 months of Daily data to 20 years of Monthly data
- Set the chart type to Candlesticks, High-Low-Close (HLC) bars, or a Solid Line
- Parameters can be modified
- Indicators include Volume, OBV, Volume A/D, Rate of Change, Stochastics, RSI, MACD, Follow Through Day, Relative High and Low, SMA (single, double, and triple crossover), Bollinger Bands, and Price Channels
- Tap a list to view current prices for all symbols in the list. It shows the gain or loss for a position if Buy Price was entered for a symbol. Then, tap a symbol in the list to view its chart
- A symbol's trading details (if any) are also shown. Trading details may include purchase date, position (number shares), buy price, target and stop
-The profitability of Buy and Sell signals generated by indicators are tracked individually on a Trades screen and a comparison of the relative profitability of all indicators over the time frame is also calculated
Charts:
- Zoom in the right half of the chart
- Zoom out to view all data
- Define a zoom range on the chart by tapping, holding, and moving two fingers
- Tap anywhere over the right price axis to see a horizontal price line on the chart
- Tap anywhere over the price bars to see a price box on the chart. The price box for a price bar shows the Date, Open, High, Low, Close and Volume
- The Chart Type (Candlestick/HLC Bars/Solid line) and the type and date range of price bars can be changed using menu settings
- ’Finger Swipe’ the Indicators section of the chart to cycle through the available indicators. Indicators can be customized using menu settings
- Add trend-lines to the chart. A trend-line can be added with one or two fingers
- Add support lines.
- Add Retracement lines.
- Send Chart in Email with a screen-shot attachment
- Save Chart for Offline for later review
- Go Back or Go Forward through the charts of symbols in a list
- Enter symbol to view its chart
Trade Charts:
- Planned for a future release.
keywords: stock, stocks, stock market, quotes, candlestick, technical analysis, chart, portfolio, trend line, support, retracement, trading, back-testing, price patterns
About EE Stock Charts
EE Stock Charts is a paid app for Android published in the Accounting & Finance list of apps, part of Business.
The company that develops EE Stock Charts is Retep Civorodot. The latest version released by its developer is 19.
To install EE Stock Charts on your Android device, just click the green Continue To App button above to start the installation process. The app is listed on our website since 2015-03-23 and was downloaded 4 times. We have already checked if the download link is safe, however for your own protection we recommend that you scan the downloaded app with your antivirus. Your antivirus may detect the EE Stock Charts as malware as malware if the download link to com.retepcivorodot.stockcharts is broken.
How to install EE Stock Charts on your Android device:
- Click on the Continue To App button on our website. This will redirect you to Google Play.
- Once the EE Stock Charts is shown in the Google Play listing of your Android device, you can start its download and installation. Tap on the Install button located below the search bar and to the right of the app icon.
- A pop-up window with the permissions required by EE Stock Charts will be shown. Click on Accept to continue the process.
- EE Stock Charts will be downloaded onto your device, displaying a progress. Once the download completes, the installation will start and you'll get a notification after the installation is finished.
